Option Parameters
Long Call Quick Reference
P/L at Expiration:
P/L = max(S - K, 0) × 100 × Qty - Total Cost
Total Cost = Premium per Share × 100 × Qty
Key Terms:
- S = Stock price at expiration
- K = Strike price
- Qty = Number of contracts
- Breakeven = K + Premium per share
Key Metrics
Formula Breakdown
P/L Diagram
Understanding Long Calls
What Is a Long Call Option?
A long call option gives you the right, but not the obligation, to buy shares of a stock at a fixed price (the strike price) before a set expiration date. You pay a premium to purchase the call, and your maximum loss is limited to that premium.
Long calls are a bullish strategy: you profit when the stock price rises above the breakeven price (strike + premium paid). The profit potential is theoretically unlimited because stocks have no upper limit.
Key Characteristics
- Max Loss: Limited to the total premium paid (entry cost)
- Max Profit: Theoretically unlimited as the stock rises
- Breakeven: Strike price + premium paid per share
- Outlook: Bullish (you expect the stock to rise)
- Time Decay: Works against you (option loses value as time passes)
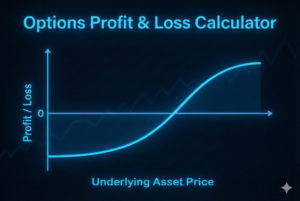
How to Read the P/L Chart
The solid blue line (At Expiration) shows your profit or loss if you hold the option until it expires. The bent shape at the strike price (the "hockey stick") shows the long call's limited downside and stock-like upside above the strike.
The dashed dark blue line (Today / T+0) represents your theoretical P/L at trade entry, computed using the Black-Scholes model. If the stock rises immediately after entry, you can profit even if the price is below the expiration breakeven. The gap between the two lines illustrates time decay: the value lost as time passes until expiration.
IV Mode vs. Premium Mode
IV Mode: Enter the implied volatility, and the calculator uses the Black-Scholes model to estimate the theoretical call premium. This mode also enables the "Today (T+0)" P/L curve on the chart, showing how the option value changes before expiration.
Premium Mode: Enter the exact premium you paid (or plan to pay) per share. This is useful when you know the actual market price. In this mode, only the expiration payoff curve is shown because IV is needed to compute theoretical values before expiration.
When to Use a Long Call
- You expect a significant upward move in the stock price
- You want leveraged exposure to the upside with limited risk
- You prefer defined risk (can't lose more than the premium paid)
- You want to control more shares with less capital than buying stock outright
Frequently Asked Questions
Disclaimer
This calculator is for educational purposes only. Options trading involves significant risk of loss. Actual option prices and P/L may differ due to market conditions, bid-ask spreads, dividends, early exercise (American options), and other factors. The Black-Scholes model makes simplifying assumptions including constant volatility and European-style exercise. This is not financial advice. Consult a qualified professional before making investment decisions.
Related Calculators


Wharton Online
Business & Financial Modeling Certificate
Master financial modeling, valuation, and quantitative analysis with this comprehensive certificate program from Wharton Online.
- Financial modeling fundamentals
- Quantitative analysis methods
- Valuation techniques
- Taught by Wharton faculty
Use code RYANOC for up to $500 off
 via
via

