Option Parameters
Long Put Quick Reference
P/L at Expiration:
P/L = max(K - S, 0) × 100 × Qty - Total Cost
Total Cost = Premium per Share × 100 × Qty
Key Terms:
- S = Stock price at expiration
- K = Strike price
- Qty = Number of contracts
- Breakeven = K - Premium per share
Key Metrics
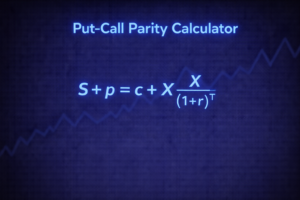
Formula Breakdown
P/L Diagram
Understanding Long Puts
What Is a Long Put Option?
A long put option gives you the right, but not the obligation, to sell 100 shares of the underlying stock at the strike price before expiration. You pay a premium upfront for this right.
Long puts are a bearish strategy: you profit when the stock price declines below the breakeven price (strike price minus premium paid). If the stock stays above the strike at expiration, the put expires worthless and you lose the premium.
Key Characteristics
- Max Profit: (Strike Price × 100 × Contracts) minus total premium paid — occurs when the stock falls to $0
- Max Loss: Limited to the total premium paid (entry cost)
- Breakeven: Strike price minus premium paid per share
- Outlook: Bearish (you expect the stock to decline)
- Time Decay: Works against you (option loses value as time passes)
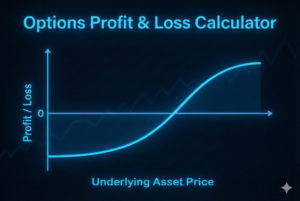
How to Read the P/L Chart
The solid blue line (At Expiration) shows your profit or loss if you hold the position until expiration. The bent shape shows the long put's increasing profit as the stock falls below the strike, capped at maximum profit when the stock reaches zero. Above the strike, the put expires worthless and your loss is limited to the premium paid.
The dashed dark blue line (Today / T+0) represents your theoretical P/L at trade entry, computed using the Black-Scholes model. Near the strike and out-of-the-money, the T+0 curve sits above the expiration line because the option still holds time value. As time passes, the T+0 curve sinks toward the expiration curve — this is time decay eroding the option's value. For deep in-the-money puts, the T+0 curve may dip below the expiration line due to the present-value discount in European option pricing.
IV Mode vs. Premium Mode
IV Mode: Enter the implied volatility, and the calculator uses the Black-Scholes model to estimate the theoretical put premium. This mode also enables the "Today (T+0)" P/L curve on the chart, showing how the option value changes before expiration.
Premium Mode: Enter the exact premium you paid (or plan to pay) per share. This is useful when you know the actual market price. In this mode, only the expiration payoff curve is shown because IV is needed to compute theoretical values before expiration.
When to Use a Long Put
- You expect the stock to decline significantly
- You want leveraged downside exposure with limited risk
- You prefer a defined maximum loss (only the premium)
- You want to hedge an existing long stock position against downside
Frequently Asked Questions
Disclaimer
This calculator is for educational purposes only. Options trading involves significant risk of loss. Actual option prices and P/L may differ due to market conditions, bid-ask spreads, dividends, early exercise (American options), and other factors. The Black-Scholes model makes simplifying assumptions including constant volatility and European-style exercise. This is not financial advice. Consult a qualified professional before making investment decisions.
Related Calculators

Course by Ryan O'Connell, CFA, FRM
Options Mastery: From Theory to Practice
Master options trading from theory to practice. Covers fundamentals, Black-Scholes pricing, Greeks, and basic to advanced strategies with hands-on paper trading in Interactive Brokers.
- 100 lessons with 7 hours of video
- Black-Scholes, Binomial & Greeks deep dives
- Basic to advanced strategies (spreads, straddles, condors)
- Hands-on paper trading with Interactive Brokers
