Stock Portfolio Monte Carlo Simulation Excel Spreadsheet
Price range: $0.00 through $20.00
Take your stock portfolio management to the next level with the Stock Portfolio Monte Carlo Simulation Excel Spreadsheet developed by Ryan O’Connell, CFA, FRM. This tool allows you to define assumptions about the S&P 500 Index, calculate your portfolio’s potential ending value, run Monte Carlo simulations, and analyze stock portfolio summary statistics. With the built-in histogram, you can easily visualize your simulation results, giving you a broad understanding of the potential outcomes of your investment strategy. While this powerful tool assists with your decision-making process, it is intended to complement, not replace, professional financial advice.
Description
Take control of your stock portfolio planning with our Stock Portfolio Monte Carlo Simulation spreadsheet, developed by Ryan O’Connell, CFA, FRM. This innovative tool allows you to apply advanced simulation techniques traditionally used by financial analysts and portfolio managers directly in Excel.
This product provides the following features:
- Defining Assumptions about S&P 500 Index: Enter your assumptions about the index to model your portfolio. You have the flexibility to use historical data, personal estimates, or a combination of both to make your predictions about future performance.
- Calculating the Ending Value of the Portfolio: Based on your assumptions, the tool calculates the potential ending value of your portfolio. This dynamic feature allows you to visualize the possible financial outcomes of your investment strategy.
- Monte Carlo Simulation: Create a Monte Carlo simulation using the built-in data table in Excel. This powerful feature lets you run hundreds, or even thousands, of different scenarios to see a wide range of potential outcomes.
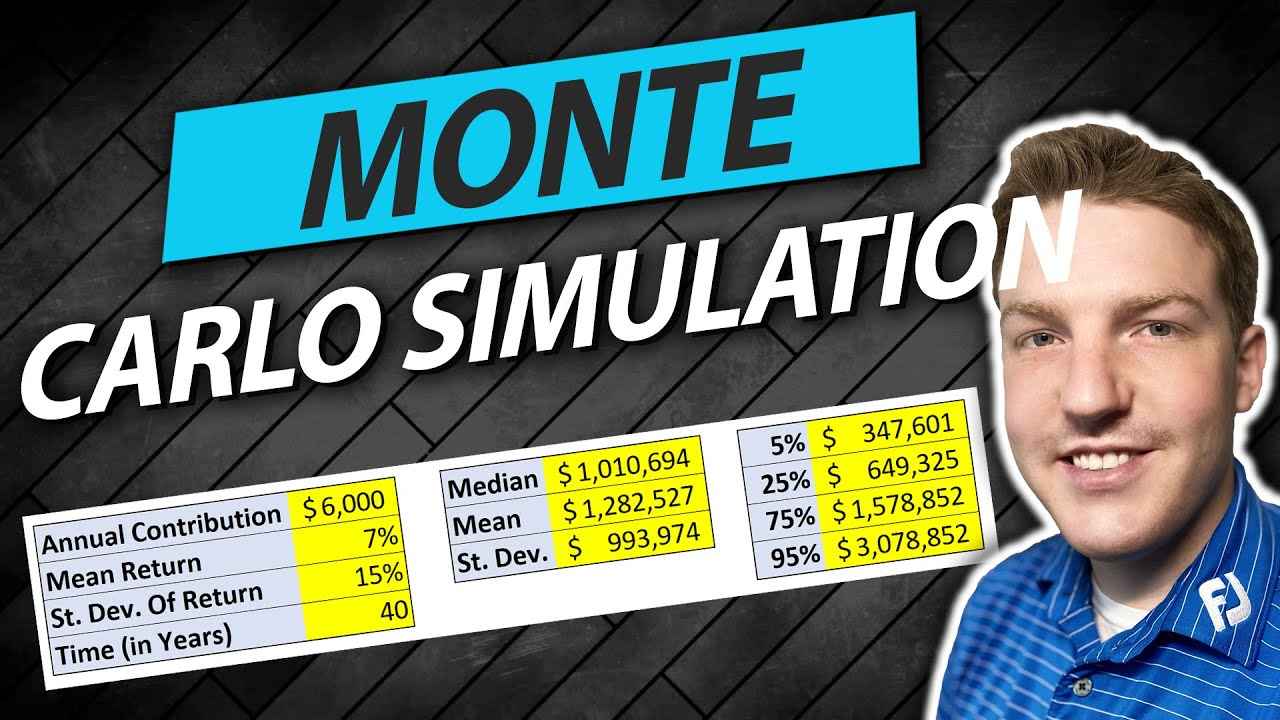
- Stock Portfolio Summary Statistics: Automatically calculate key summary statistics for your stock portfolio, such as mean, standard deviation, and percentiles. These figures can give you a solid understanding of the expected return and risk associated with your portfolio.
- Histogram of Simulation Results: Visualize your simulation results with a histogram, providing a clear and concise representation of the potential outcomes of your stock portfolio.
Please note that while this tool is a powerful aid for decision-making, it does not replace financial advice from a qualified professional. It should be used as a guide and not as the sole basis for investment decisions.
Additional information
| Select What You Think This Is Worth | $0, $5, $10, $20 |
|---|
Related products
-

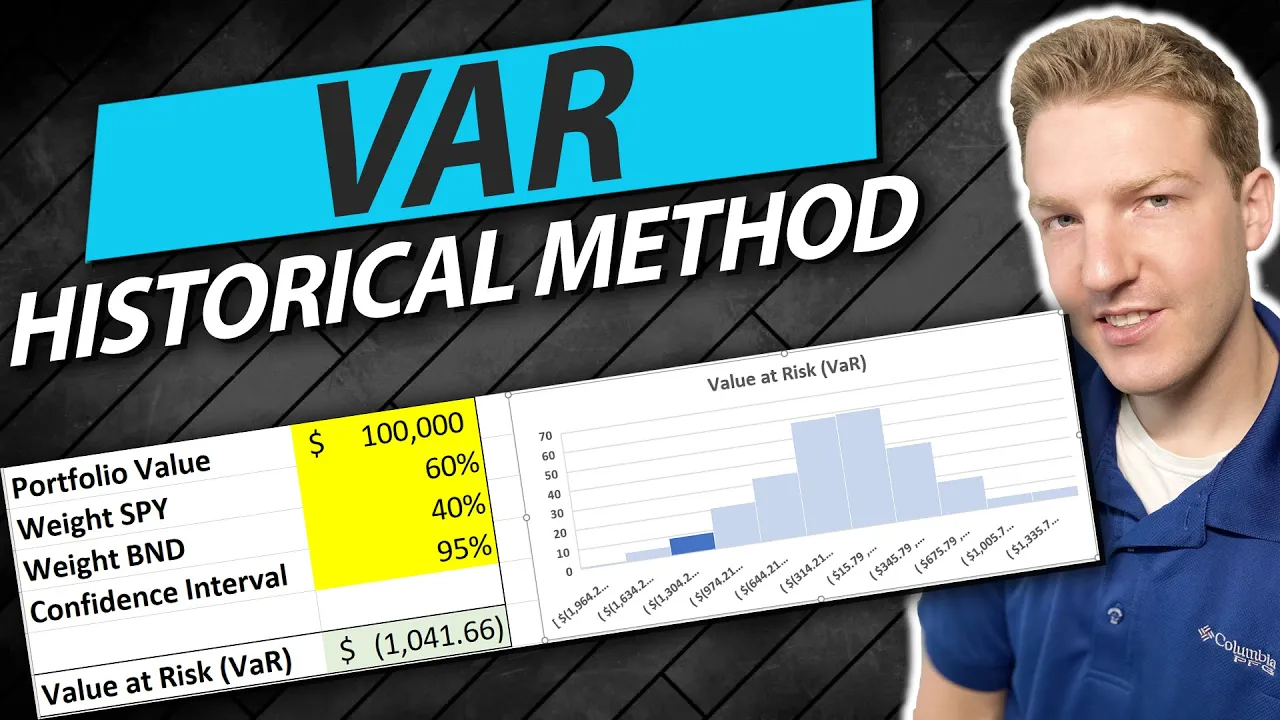
Value at Risk (VaR) Excel Workbook: A Comprehensive Tool for Risk Management
Price range: $0.00 through $20.00 Download File This product has multiple variants. The options may be chosen on the product page -
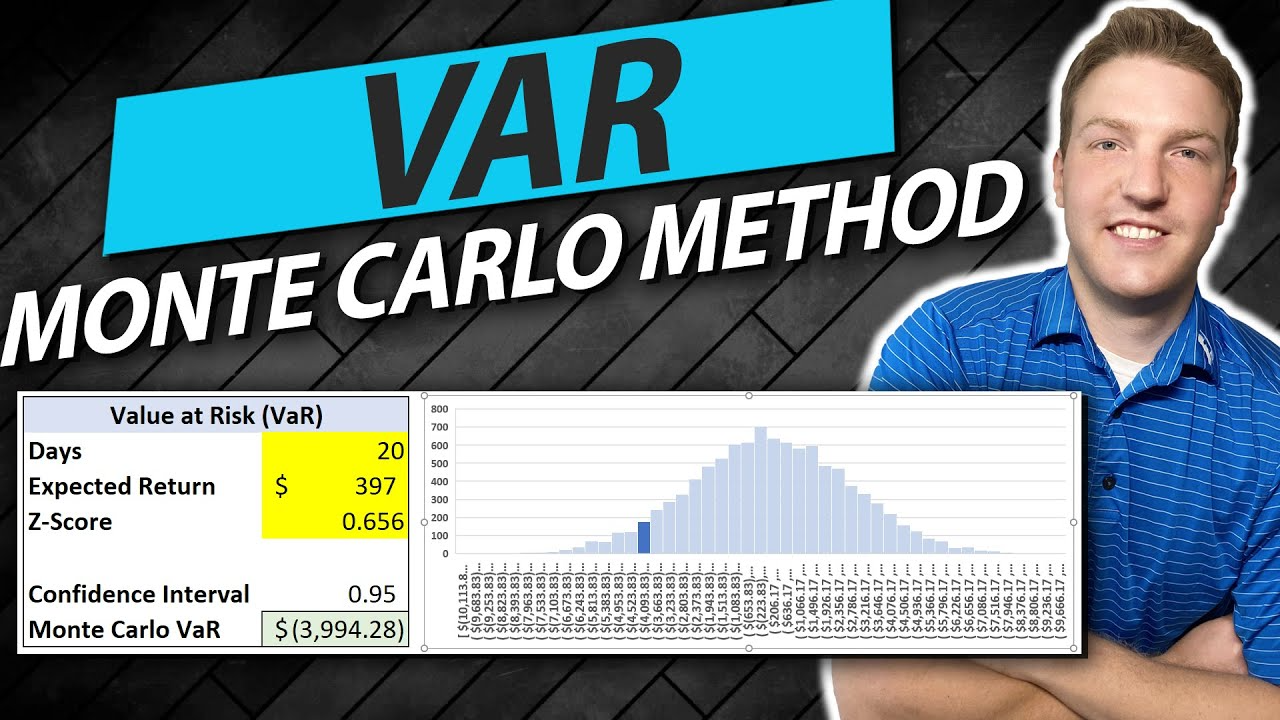
Monte Carlo Method: Value at Risk (VaR) Excel Template
Price range: $0.00 through $20.00 Download File This product has multiple variants. The options may be chosen on the product page -
Monthly to Annual Returns Excel Template (Free Download)
Price range: $0.00 through $20.00 Download File This product has multiple variants. The options may be chosen on the product page -
Information Ratio & Tracking Error Excel Workbook
Price range: $0.00 through $20.00 Download File This product has multiple variants. The options may be chosen on the product page