Investment Performance Evaluation Excel File
Price range: $0.00 through $20.00
The Investment Performance Evaluation Excel File is a comprehensive tool perfect for investors, financial analysts, and students seeking to understand and evaluate stock performance. This dynamic Excel file simplifies the process of importing stock price data, calculating daily returns, and analyzing performance through widely accepted financial metrics: Sharpe Ratio, Treynor Ratio, and Jensen’s Alpha. Please note that this tool is for evaluation purposes and not intended as financial advice; users should always perform their own due diligence or consult with a financial advisor before making investment decisions.
Description
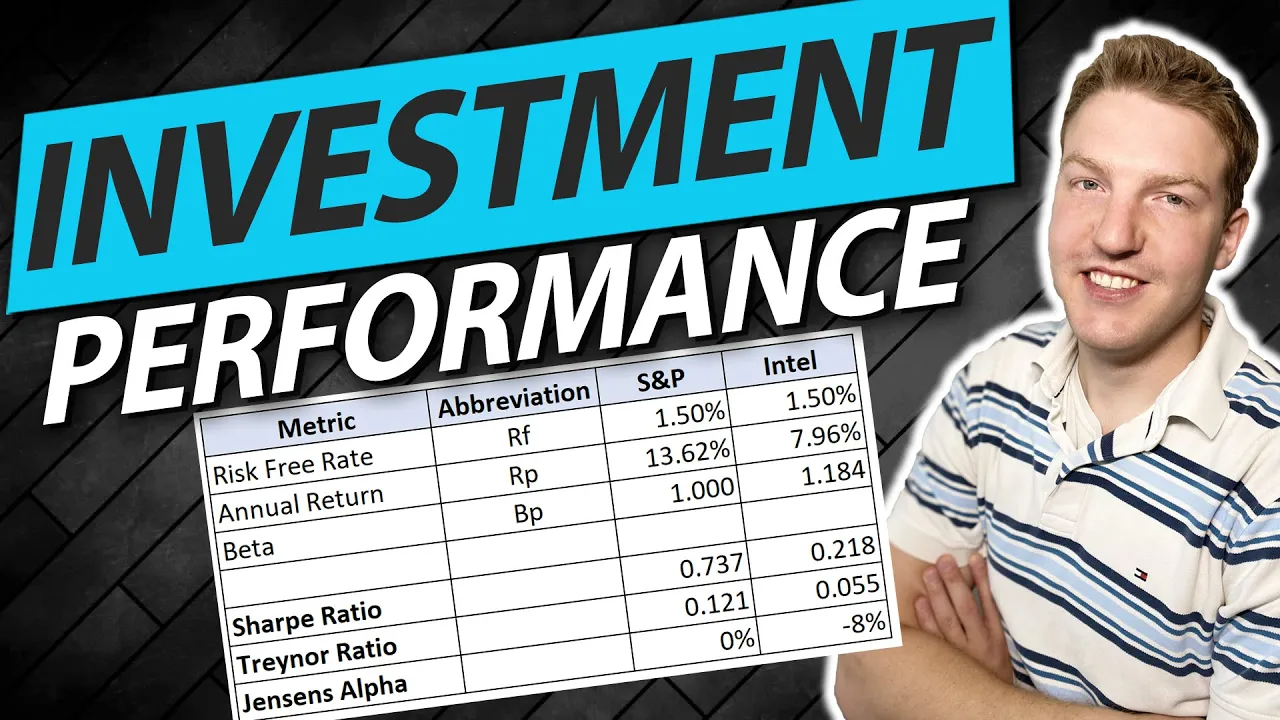
Our Investment Performance Evaluation Excel file, crafted by Ryan O’Connell, CFA, FRM, is a valuable tool for all investors, financial analysts, and students seeking a deep understanding of investment performance measurement. This Excel-based tool simplifies complex calculations and provides a structured framework for evaluating stock performance using three widely recognized financial metrics: Sharpe Ratio, Treynor Ratio, and Jensen’s Alpha.
Key Features:
- Stock Price Data Importation: The file begins by guiding you on how to import historical stock price data from Yahoo Finance, allowing for dynamic updates and comprehensive historical data analysis.
- Daily Stock Price Returns Calculation: The Excel file assists you in calculating the daily returns of your chosen stock, providing the foundation for further performance evaluation metrics.
- Sharpe Ratio Calculation: A dedicated section helps you calculate the Sharpe Ratio, a measure of risk-adjusted returns. This vital metric allows you to compare the investment’s performance relative to the risk it carries.
- Treynor Ratio Calculation: The file also includes a section for calculating the Treynor Ratio, another measure of risk-adjusted performance that takes into account systematic risk.
- Jensen’s Alpha Calculation: Lastly, the Excel file enables you to compute Jensen’s Alpha, a metric used to determine the abnormal return of a security or portfolio of securities given the expected market return.
Disclaimer: This tool serves to assist with performance evaluation and is not intended as financial advice. Always consult with a financial advisor or perform your own due diligence before making investment decisions.
Additional information
| Select What You Think This Is Worth | $0, $5, $10, $20 |
|---|
Related products
-

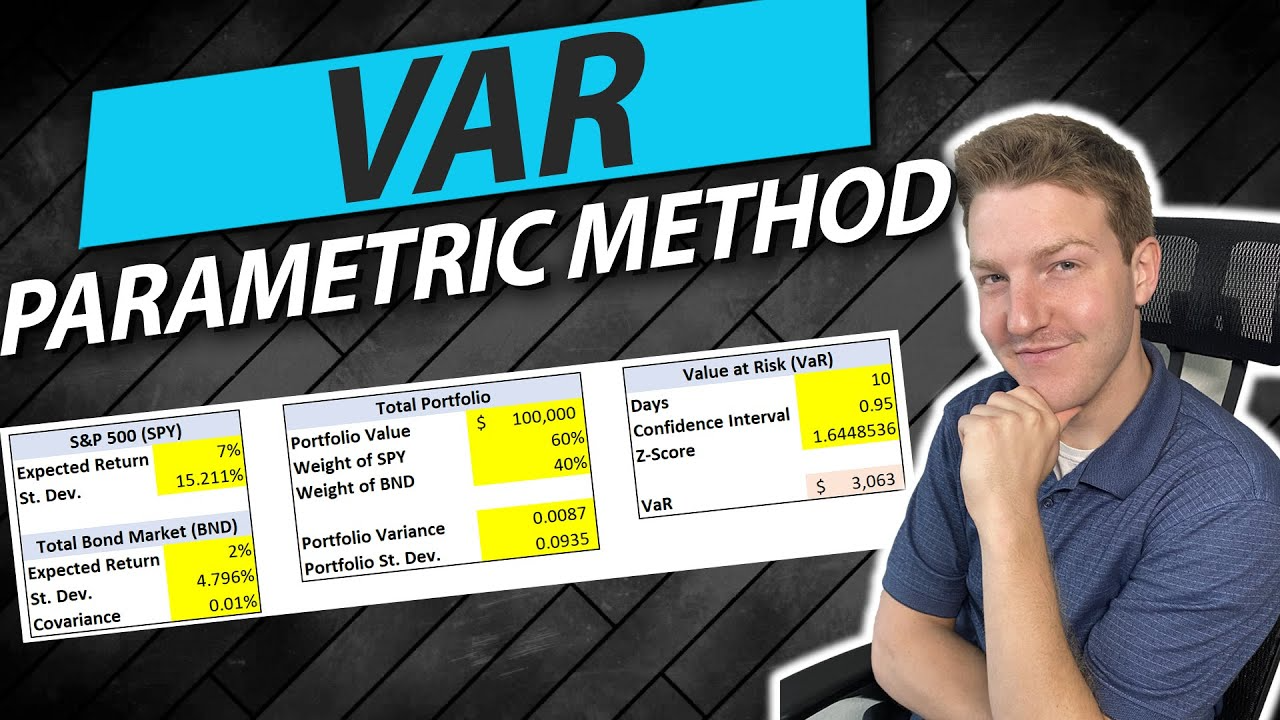
Parametric Method: Value at Risk (VaR) Excel Template
Price range: $0.00 through $20.00 Download File This product has multiple variants. The options may be chosen on the product page -
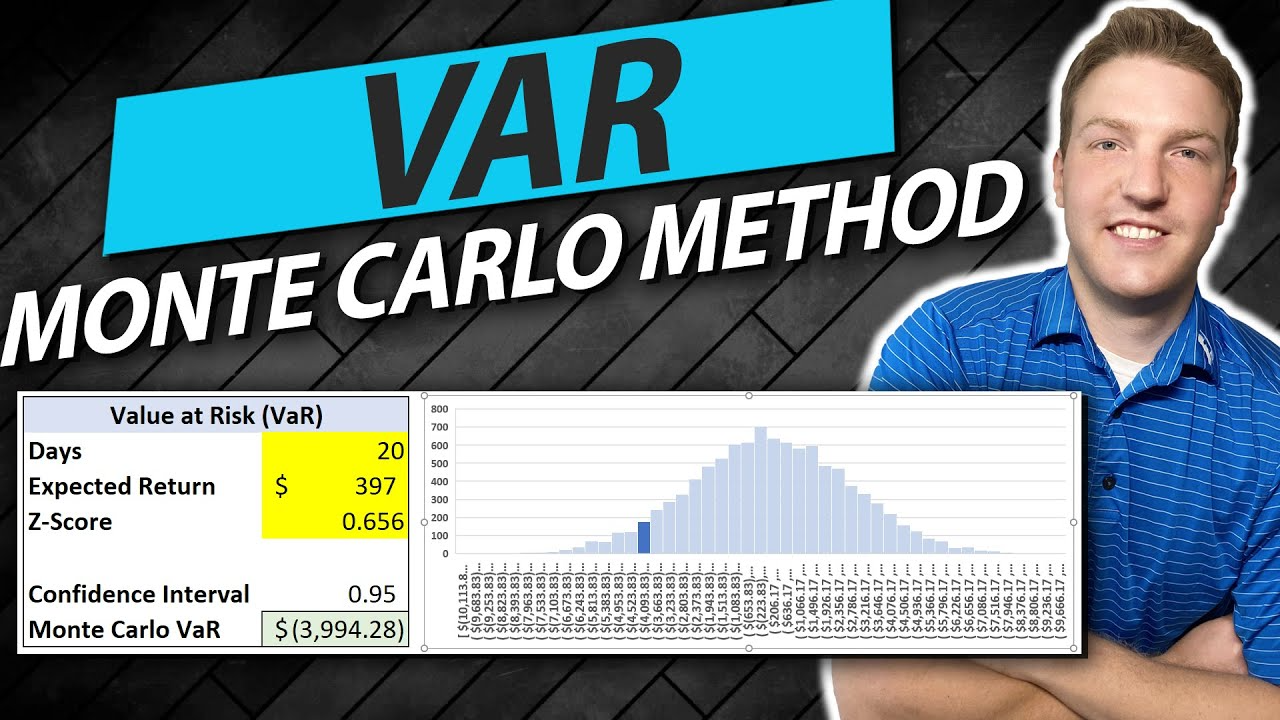
Monte Carlo Method: Value at Risk (VaR) Excel Template
Price range: $0.00 through $20.00 Download File This product has multiple variants. The options may be chosen on the product page -

Free Covariance Matrix in Excel File
Price range: $0.00 through $20.00 Download File This product has multiple variants. The options may be chosen on the product page -

Capital Market Line Calculator Excel Template
Price range: $0.00 through $20.00 Download File This product has multiple variants. The options may be chosen on the product page