Portfolio Standard Deviation Calculation Excel Example

Price range: $0.00 through $20.00
Download this Portfolio Standard Deviation Calculation Excel Example, a simple and structured spreadsheet that demonstrates how to calculate portfolio standard deviation step by step. Ideal for finance professionals, students, and investors looking for a quick reference or practice file.
Description
This Portfolio Standard Deviation Calculation Excel Example is a straightforward spreadsheet designed to help you understand and apply the standard deviation formula to a portfolio of assets. It includes sections for assigning security weights, calculating daily returns from stock prices, creating a covariance matrix, and computing overall portfolio risk. The file serves as a practical reference for finance students, CFA candidates, and investors seeking a hands-on example. Download it for free and follow along with the tutorial to reinforce your understanding of portfolio risk measurement in Excel.
Additional information
| Select What You Think This Is Worth | $0, $5, $10, $20 |
|---|
Related products
-
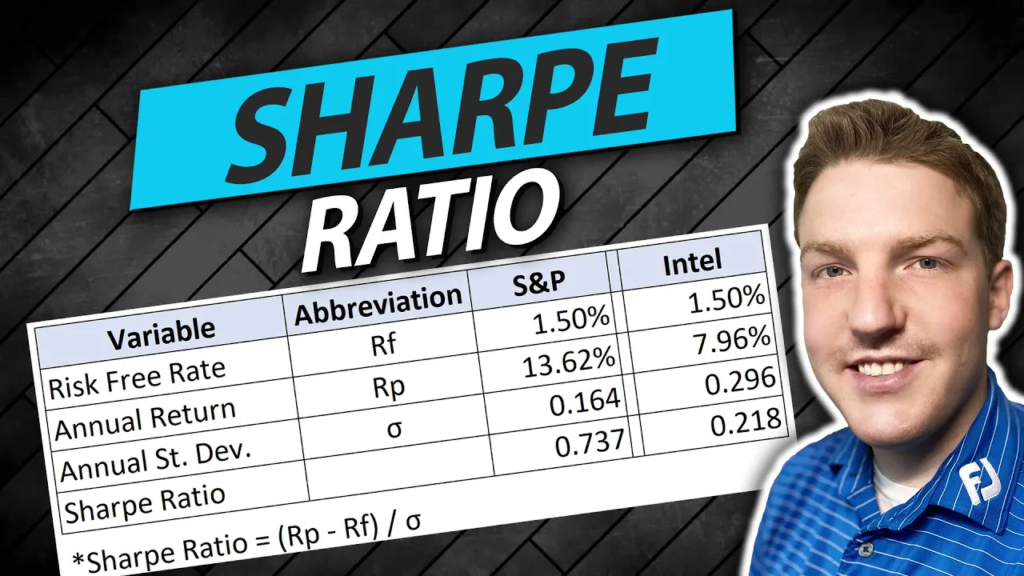
Sharpe Ratio In Excel
Price range: $0.00 through $20.00 Download File This product has multiple variants. The options may be chosen on the product page -

Information Ratio & Tracking Error Excel Workbook
Price range: $0.00 through $20.00 Download File This product has multiple variants. The options may be chosen on the product page -
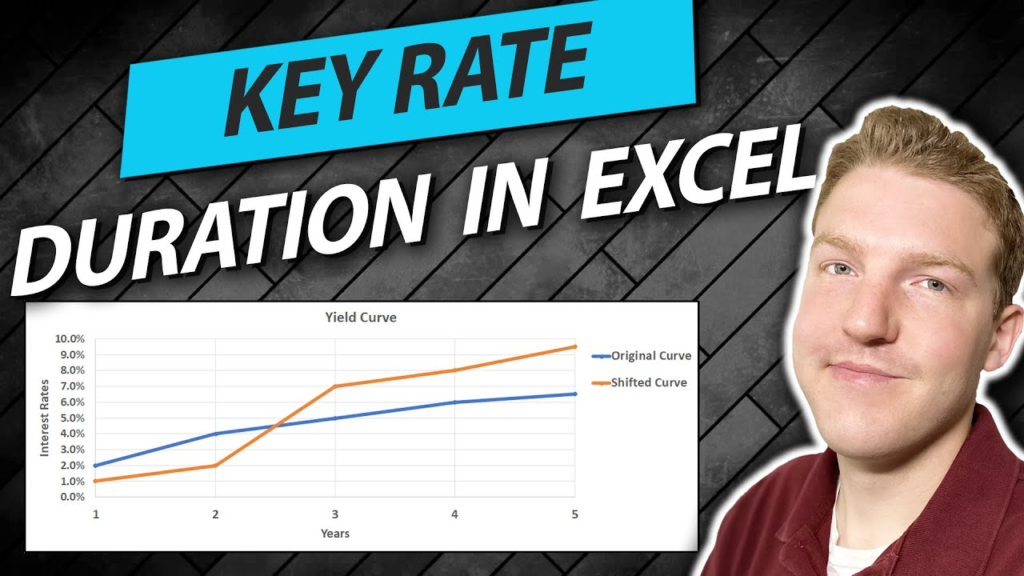
Microsoft Excel Template for Key Rate Duration & Key Rate Shifts
Price range: $0.00 through $20.00 Download File This product has multiple variants. The options may be chosen on the product page -

Bond Duration and Convexity Explainer Toolkit
Price range: $0.00 through $20.00 Download File This product has multiple variants. The options may be chosen on the product page


