
Systematic vs Unsystematic Risk: What’s the Difference?

Table of Contents
Understanding the distinction between systematic risk and unsystematic risk is one of the most important conceptual foundations in portfolio theory. Every stock carries two types of risk — one you can eliminate through diversification, and one you cannot. This distinction explains why beta exists as a risk measure, why the Capital Asset Pricing Model (CAPM) rewards only certain types of risk, and why diversification works. Whether you’re building a portfolio, evaluating individual securities, or studying for the CFA exam, mastering this framework is essential.
Systematic risk affects the entire market simultaneously (recessions, interest rate changes, geopolitical events) and cannot be diversified away. Unsystematic risk affects individual companies (earnings surprises, management changes, product failures) and can be substantially reduced by diversifying across companies, sectors and geographies. The reduction depends on portfolio weights and shared exposures, rather than a fixed stock count.
What is Systematic Risk?
Systematic risk (also called market risk or non-diversifiable risk) is the portion of a security’s volatility that stems from broad economic forces affecting all companies simultaneously. When the Federal Reserve raises interest rates, when a recession begins, or when geopolitical crises erupt, these macroeconomic shocks ripple through the entire market — no company is immune.
Systematic risk cannot be eliminated through diversification because it affects most securities, though to varying degrees. Even if you hold 100 different stocks across every sector and geography, your portfolio will still decline when systematic risk events occur. This is the irreducible baseline risk of participating in equity markets.
In the single-factor Capital Asset Pricing Model (CAPM), systematic risk is measured by beta (β) — a stock’s sensitivity to market movements. A stock with a beta of 1.5 has 50% greater sensitivity to market returns than the market index (typically the S&P 500 in U.S. equity analysis). Beta intentionally ignores company-specific factors and focuses solely on market-driven volatility.
Systematic risk is the irreducible baseline risk of equity investing. It represents macroeconomic forces that affect all stocks simultaneously — interest rates, economic growth, inflation, geopolitical events. Adding stocks does not eliminate shared market exposure; the magnitude of that exposure depends on portfolio beta.
Common sources of systematic risk include:
- Interest rate changes — When central banks adjust rates, discount rates for all future cash flows shift, affecting valuations across the market
- Recessions — Economic contractions reduce consumer spending, corporate earnings, and employment for nearly all businesses
- Inflation shocks — Rising input costs and reduced purchasing power impact all companies’ cost structures and revenue
- Geopolitical crises — Wars, trade disputes, and political instability create uncertainty that affects global markets broadly
- Market sentiment shifts — Changes in investor risk appetite cause widespread repricing of equities
What is Unsystematic Risk?
Unsystematic risk (also called idiosyncratic risk, company-specific risk, or diversifiable risk) is the portion of a security’s volatility that comes from factors unique to that particular company or industry. These are risks that affect one firm but not others — product launch success or failure, management quality, competitive positioning, regulatory actions targeting a specific company, or operational execution.
Unlike systematic risk, unsystematic risk can be largely diversified away by holding a portfolio of securities with independent risk drivers. When one company misses earnings, another might exceed expectations. When one firm faces a lawsuit, others remain unaffected. As you add uncorrelated holdings to your portfolio, company-specific shocks increasingly offset each other, and unsystematic risk declines toward zero.
Unsystematic risk is not measured by beta. In a market-model regression (the most common method for estimating beta), unsystematic risk shows up in the residuals — the variation in returns that cannot be explained by market movements. The R² statistic from this regression tells you what percentage of a stock’s total variance is systematic (explained by the market) versus unsystematic (the unexplained residuals).
Concentrated portfolios are dangerous because you bear both systematic and unsystematic risk. If you hold only one stock, you’re exposed to market-wide crashes plus company-specific disasters. Spreading portfolio weights across different sectors and geographies can substantially reduce company-specific risk. The reduction depends on shared exposures and portfolio weights, while market risk remains. This is why diversification is often called the only “free lunch” in finance.
Common sources of unsystematic risk include:
- Earnings surprises — Quarterly results above or below analyst expectations drive stock-specific volatility
- Management changes — CEO departures, executive scandals, or strategic pivots affect individual companies
- Product success or failure — New product launches, recalls, or competitive threats impact specific firms
- Litigation — Lawsuits, regulatory fines, or patent disputes target individual companies
- Operational issues — Supply chain disruptions, factory accidents, or cybersecurity breaches unique to one firm
- Competitive dynamics — Market share shifts, pricing pressure, or technological disruption affecting specific companies
Examples of Systematic vs Unsystematic Risk
To make the distinction concrete, here are real-world examples of both risk types. Notice how systematic events affect most or all equities, while unsystematic events are isolated to specific companies or narrow sectors:
| Event | Year | Risk Type | Why? |
|---|---|---|---|
| Global Financial Crisis | 2008 | Systematic | Credit freeze and recession affected most equities; S&P 500 fell 57% from peak to trough (Oct 2007 to Mar 2009). Even well-managed companies with strong balance sheets saw sharp declines. |
| COVID-19 Pandemic Crash | Feb-Mar 2020 | Systematic | Global health crisis caused simultaneous demand shock, supply chain disruptions, and uncertainty across all sectors. S&P 500 fell 34% in one month. |
| Federal Reserve Rate Hikes | 2022-2023 | Systematic | Aggressive rate increases raised discount rates for all future cash flows, repricing equities broadly. Growth stocks fell sharply as higher rates reduced present values. |
| Inflation Surge | 2021-2022 | Systematic | Elevated inflation increased input costs for all companies and reduced consumer purchasing power, affecting corporate margins and earnings across the market. |
| Enron Accounting Fraud | 2001 | Unsystematic | Enron collapsed from $90 to $0 due to accounting fraud, but the broader market was unaffected. Shareholders bore company-specific risk from management misconduct. |
| Boeing 737 MAX Grounding | 2019-2020 | Unsystematic | Two fatal crashes led to a global grounding of Boeing’s 737 MAX fleet. Boeing stock fell 25%, but Airbus (competitor) actually benefited as airlines shifted orders. Pure company-specific operational risk. |
| Tesla Production Targets | 2018-2019 | Unsystematic | Tesla stock swung wildly based on whether the company hit quarterly production targets — operational execution specific to one automaker, not the broader market. |
| Wells Fargo Account Scandal | 2016 | Unsystematic | Wells Fargo employees opened millions of unauthorized accounts, leading to fines and reputational damage. The scandal affected Wells Fargo specifically, not the banking sector broadly. |
| Facebook/Meta Rebranding | 2021 | Unsystematic | Meta’s strategic pivot to the metaverse and significant R&D spending created company-specific uncertainty. Competitors (Google, Amazon) followed different strategies and were unaffected. |
Key observation: During the 2008 Global Financial Crisis, most equities declined sharply regardless of individual company fundamentals — systematic risk dominated. In contrast, when Boeing’s 737 MAX was grounded, only Boeing shareholders suffered significant losses, while Airbus shareholders benefited. This asymmetry is the signature of unsystematic risk — it affects specific firms, not the market as a whole, and can be diversified away.
Systematic vs Unsystematic Risk: The Key Differences
The table below summarizes the fundamental differences between systematic and unsystematic risk. Understanding these distinctions is essential for portfolio construction, risk management, and interpreting asset pricing models:
Systematic Risk
- Scope: Affects the entire market or large segments simultaneously
- Diversification: Cannot be eliminated — remains no matter how many holdings you add
- Drivers: Macroeconomic factors (interest rates, recessions, inflation, geopolitical events)
- Measurement: Quantified by beta (β) in single-factor models — a stock’s sensitivity to market movements
- Compensation: Investors are compensated for bearing systematic risk in equilibrium (CAPM predicts higher expected returns for higher beta)
- Portfolio impact: Remaining market risk depends on portfolio beta; equity portfolios do not all share the same risk floor
- Market proxy: Typically measured relative to the S&P 500 (U.S. equities) or another broad market index
- Examples: 2008 financial crisis, COVID-19 crash, Fed rate hikes, inflation surges
Unsystematic Risk
- Scope: Affects individual companies or narrow industries in isolation
- Diversification: Can be substantially reduced by spreading weights across holdings with different risk drivers; no fixed stock count guarantees a particular reduction
- Drivers: Company-specific factors (earnings, management, product success, lawsuits, competition, operations)
- Measurement: Not measured by beta — shows up as residual variance (unexplained by market) in regression models
- Compensation: Investors are not compensated for unsystematic risk in equilibrium (because you can diversify it away for free)
- Portfolio impact: Largely eliminated by holding well-diversified portfolios across sectors and geographies
- R² insight: The unexplained portion of variance in market-model regression represents unsystematic risk
- Examples: Enron fraud, Boeing 737 MAX grounding, CEO departures, earnings misses, product recalls
The CAPM assumes investors are rational and hold well-diversified portfolios. If you can eliminate unsystematic risk by simply holding more stocks — at essentially no cost — why would the market compensate you for bearing it? The market only pays higher expected returns for systematic risk (measured by beta), because that’s the risk you must bear to participate in equity markets. Unsystematic risk is optional — you take it on by choice when you hold concentrated positions.
Scenario: To illustrate the calculation, suppose Tesla (TSLA) has a beta of 2.0 and total annualized volatility of 55%, while market volatility is 15% annualized. These are hypothetical inputs, not current or historical estimates for Tesla. How does total variance split into systematic and unsystematic components?
Assumptions:
- Hypothetical Tesla beta: 2.0
- Hypothetical market volatility: 15% annualized
- Hypothetical Tesla total volatility: 55% annualized
- Market-model assumption: The market-driven component and company-specific residual are uncorrelated, so their variances add
Step 1: Calculate systematic variance
Systematic variance = β² × Market variance
= (2.0)² × (0.15)² = 4.0 × 0.0225 = 0.09
Step 2: Calculate unsystematic variance
Total variance = Systematic variance + Unsystematic variance
(0.55)² = 0.09 + Unsystematic variance
0.3025 = 0.09 + Unsystematic variance
Unsystematic variance = 0.2125
Step 3: Convert to volatility (standard deviation)
Systematic volatility = √0.09 = 0.30 = 30%
Unsystematic volatility = √0.2125 ≈ 0.461 = 46.1%
Total volatility = √0.3025 = 0.55 = 55% (matches our input)
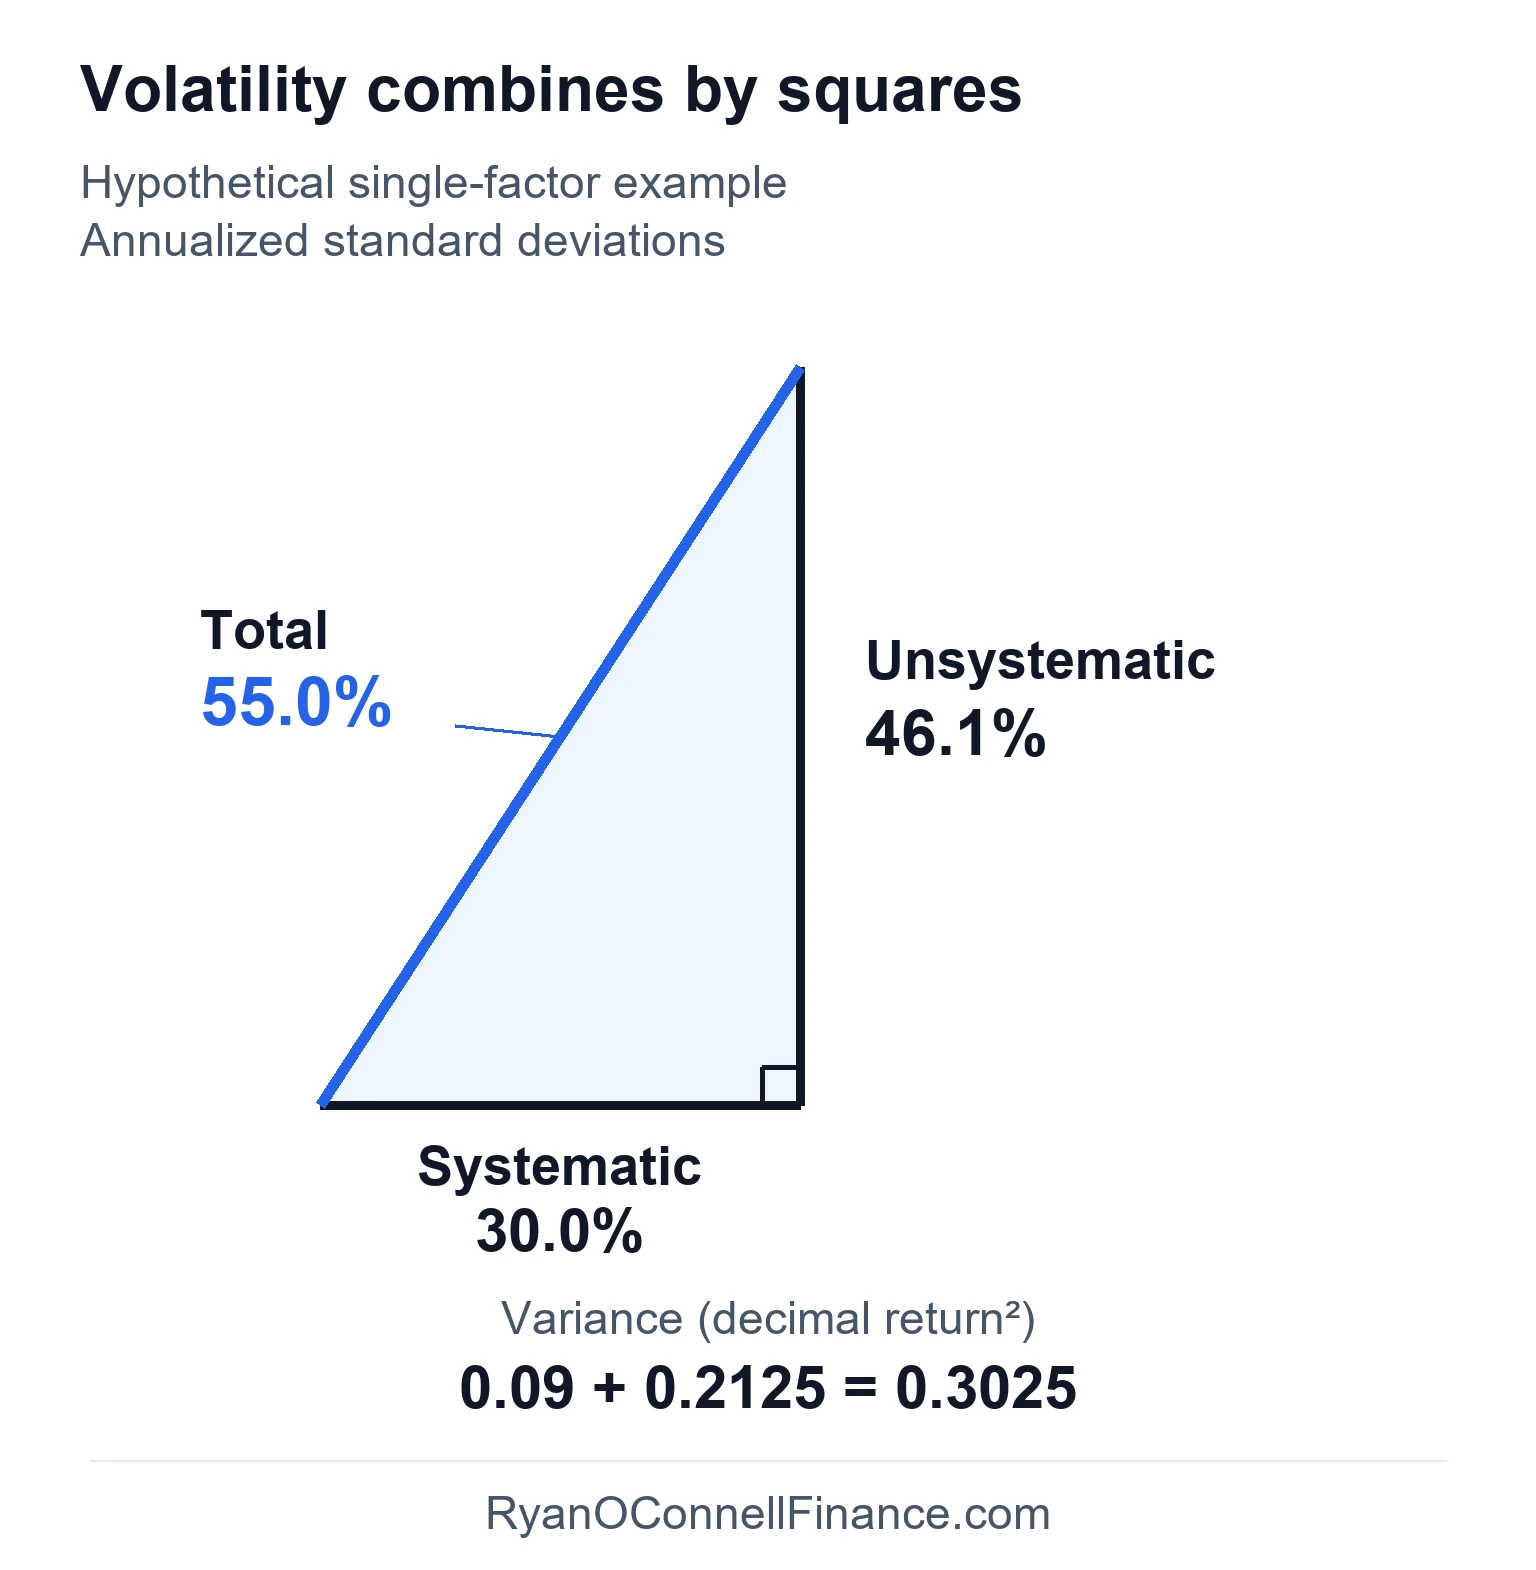
Interpretation: The market-driven component explains 29.8% of total variance (0.09 / 0.3025), while company-specific risk explains 70.2%. Diversification can reduce the portfolio contribution of company-specific risk; market exposure depends on portfolio beta.
Caveat: This is a hypothetical single-factor market-model illustration. In an estimated regression with an intercept, R² is the market-explained share of variance and the residual captures variation unexplained by that model. Diversification benefits depend on how strongly those residual returns co-move across holdings.
How Diversification Eliminates Unsystematic Risk
The power of diversification lies in its ability to reduce unsystematic risk without sacrificing expected returns. When you hold multiple stocks with independent risk drivers, company-specific shocks increasingly offset each other, and your portfolio’s total risk declines. However, diversification cannot eliminate systematic risk. At a fixed portfolio beta, the market-wide component remains unchanged as independent company-specific risks are averaged out.
As you add holdings to your portfolio:
- Unsystematic variance declines when portfolio weights are spread across holdings with sufficiently independent company-specific returns
- Systematic variance stays fixed at a given portfolio beta in the model below; changing beta changes this floor
A hypothetical risk reduction curve: Reuse the component variances above and assume equal portfolio weights, a beta of 2.0 for every stock, and mutually uncorrelated company-specific residuals with identical variance. For N holdings, portfolio variance is 0.09 + 0.2125 / N. The market-driven component stays fixed while residual variance falls as 1/N.
| Stocks held (number) | Total (%) | Systematic (%) |
|---|---|---|
| 1 | 55.0 | 30.0 |
| 2 | 44.3 | 30.0 |
| 5 | 36.4 | 30.0 |
| 10 | 33.4 | 30.0 |
| 20 | 31.7 | 30.0 |
| 30 | 31.2 | 30.0 |
| 50 | 30.7 | 30.0 |
Hypothetical calculated points; equal weights, identical market exposures and uncorrelated company-specific residuals.
At 30 holdings, annualized portfolio volatility is 31.2%, close to the 30.0% systematic floor; the single-stock value was 55.0%. These calculated points illustrate the mechanism rather than a universal stock-count rule.
For a detailed breakdown of how portfolio size affects risk reduction, see our guide on Portfolio Diversification.
Why correlation matters: Diversification benefits depend on return correlation and shared risk drivers. Many oil companies can still share substantial sector risk. The 1/N calculation above assumes company-specific residuals are uncorrelated, so it does not apply unchanged to concentrated sector portfolios. Effective diversification requires spreading across:
- Sectors — Technology, healthcare, utilities, consumer staples, financials, etc.
- Geographies — U.S., developed international, emerging markets
- Business models — Growth vs value, cyclical vs defensive, large-cap vs small-cap
The R² statistic from a market-model regression tells you how much of a stock’s variance is systematic (explained by the market). For example, if a stock has R² = 0.40, then 40% of its variance is systematic and 60% is unsystematic. In a single-factor model, reducing residual variance while holding beta and market variance fixed raises R². Diversification alone does not guarantee an R² near 1.0 against a particular market proxy.
How to Manage Each Risk Type
Because systematic and unsystematic risks have different properties, they require different management strategies:
Managing Unsystematic Risk: Diversification
- Spread portfolio weights across companies, sectors and geographies; the reduction in unsystematic risk depends on concentration and shared exposures
- Avoid sector concentration — spreading across uncorrelated industries (tech, healthcare, utilities) is more effective than holding many stocks in the same sector
- Use index funds — Broad-market index funds (S&P 500, total stock market) can make company-specific risk very small by spreading weights across many stocks
- Rebalance periodically to maintain diversification as holdings drift over time
Managing Systematic Risk: Asset Allocation and Beta Targeting
- Asset allocation — Mix equities with bonds, cash, or alternative assets that have lower correlation to the stock market during downturns
- Beta targeting — If you want less systematic risk, tilt toward low-beta stocks (utilities, consumer staples) or reduce equity exposure entirely
- Hedging — Use derivatives (put options, futures) to hedge systematic risk during periods of elevated uncertainty
- Time horizon — Systematic risk matters most for short time horizons; longer-term investors can ride out market cycles
- Accept it — Many investors accept systematic risk as the price of participating in equity markets’ long-term expected returns
The key insight: Diversification is free (or nearly so — transaction costs are minimal), so there’s no excuse for bearing unsystematic risk. Systematic risk, however, is unavoidable if you want equity exposure, so you must decide how much systematic risk aligns with your goals, time horizon, and risk tolerance.
Systematic Risk, Beta, and the CAPM
The entire Capital Asset Pricing Model (CAPM) is built on the systematic/unsystematic distinction. In the CAPM framework, beta measures a stock’s exposure to systematic risk, and the model predicts that only systematic risk is compensated with higher expected returns.
Key observations:
- Beta measures only systematic risk — In a market-model regression, beta is the slope coefficient that captures how much a stock moves with the market. The residuals represent unsystematic risk, which beta intentionally ignores.
- Expected return depends only on beta — Two stocks with the same beta should have the same expected return in equilibrium, even if they have different total volatilities. Why? Because the difference in total volatility is unsystematic risk, which investors can diversify away for free.
- CAPM predicts equilibrium expected returns — It does not predict short-term realized returns. The model says that over long periods and in expectation, higher-beta stocks should deliver higher average returns as compensation for bearing more systematic risk.
Stock A: Total volatility σ = 30%, Beta β = 1.2
Stock B: Total volatility σ = 20%, Beta β = 1.2
Stock B has lower total risk, but both stocks have the same systematic risk (β = 1.2). According to CAPM, they should have the same expected return because they contribute the same amount of undiversifiable risk to a well-diversified portfolio. Stock B’s lower total volatility simply means it has less unsystematic risk — but that doesn’t earn a risk premium because investors can diversify it away.
Implication: When evaluating stocks for a diversified portfolio, beta (systematic risk) is more relevant than total volatility (which includes unsystematic risk that you’ll diversify away).
Model-dependent caveat: Beta measures systematic risk in the single-factor CAPM. Multi-factor models (Fama-French 3-factor, 5-factor, etc.) identify additional risk factors beyond “the market” — such as size, value, profitability, and investment. These factors capture systematic risks not fully explained by market beta alone. In practice, the systematic/unsystematic boundary is more nuanced than the binary CAPM view suggests.
For a deep dive into how the CAPM uses beta to price systematic risk, see our guide on the Capital Asset Pricing Model.
Common Mistakes
Even experienced investors sometimes confuse systematic and unsystematic risk or misapply the distinction. Here are the most common mistakes to avoid:
1. Assuming diversification eliminates all risk
Mistake: “If I hold 30 stocks, my portfolio is safe from large losses.”
Reality: Diversification only eliminates unsystematic risk. Systematic risk remains. If the market falls 20% during a recession, a well-diversified portfolio will also fall approximately 20% (depending on portfolio beta). You cannot diversify your way out of a bear market or recession — those are systematic events affecting all equities.
2. Confusing high beta with high volatility
Mistake: “This stock has 40% volatility, so it must have a high beta.”
Reality: A stock can be highly volatile but have a low beta if most of its volatility is unsystematic (company-specific). Example: A biotech stock awaiting FDA approval might have 60% total volatility but β = 0.7 because its outcome is largely uncorrelated with the economy. Conversely, a utility stock might have low total volatility but β = 1.0 because nearly all its risk is systematic. Total volatility (measured by standard deviation) captures both types of risk; beta captures only systematic risk.
3. Confusing the two types of risk in analysis
Mistake: “Company X has high unsystematic risk (lawsuit pending), so I should demand a higher expected return.”
Reality: In a well-diversified portfolio, unsystematic risk is irrelevant to expected returns because you can eliminate it by holding other stocks. The CAPM says the market does not compensate you for bearing diversifiable risk. You should demand higher returns only for higher systematic risk (higher beta), not for company-specific risks you can diversify away.
4. Over-diversifying within one sector or geography
Mistake: “I hold 40 technology stocks, so I’m well-diversified.”
Reality: Holding many stocks in the same sector doesn’t eliminate sector-specific or thematic risks. If regulatory pressure hits big tech, interest rate sensitivity affects growth stocks, or a common supply chain issue emerges, all your holdings will move together. True diversification requires spreading across uncorrelated sectors (technology, healthcare, utilities, financials), geographies (U.S., international, emerging markets), and business models (growth, value, cyclical, defensive).
5. Ignoring correlation breakdowns during crises
Mistake: “I’m diversified across 10 uncorrelated sectors, so I’m protected from market crashes.”
Reality: During extreme stress events (2008, COVID-19), correlations often rise substantially as common factors dominate and liquidity evaporates. Assets that seemed uncorrelated during calm markets often move together during crises. This doesn’t invalidate diversification — it still helps — but it means diversification provides less protection precisely when you need it most. This phenomenon is sometimes called “correlation breakdown,” and it reflects the reality that systematic risk becomes more dominant during severe downturns.
Limitations of the Systematic/Unsystematic Framework
While the systematic/unsystematic distinction is foundational to modern portfolio theory, it has important limitations and caveats in practice:
In practice, the line between systematic and unsystematic risk can blur. A major industry regulation (e.g., banking reform after 2008) might seem company-specific but actually affects an entire sector. Factor models (Fama-French, etc.) add nuance by identifying intermediate risk factors like size, value, and momentum that sit between pure market risk and pure company-specific risk. The binary classification is a useful simplification, but real-world risk is more granular.
1. Factor models complicate the binary view
Modern asset pricing uses multi-factor models (Fama-French 3-factor, 5-factor, etc.) that identify risk factors beyond “the market” — such as the size premium (small-cap vs large-cap), value premium (value vs growth), profitability, and investment. Are these factors systematic or unsystematic? They’re intermediate: diversifiable across factors, but not within them. A pure small-cap portfolio is exposed to size risk, which is systematic within that slice of the market. The systematic/unsystematic framework from CAPM is a single-factor simplification; multi-factor models reveal a richer risk structure.
2. Correlations change over time
The assumption that unsystematic risks are independent breaks down during crises. In 2008, housing-related stocks were supposed to have idiosyncratic risk, but the entire sector collapsed together as the subprime crisis spread. During COVID-19, travel, hospitality, and retail all moved in lockstep despite being different industries, because the common factor (pandemic lockdowns) dominated. What was “unsystematic” in normal times became “systematic” during the crisis. Correlations are not stable — they spike during stress events, reducing the benefits of diversification precisely when you need them most.
3. The framework assumes large, liquid portfolios
The theoretical ability to diversify away unsystematic risk assumes you can freely buy and hold many securities. For individual investors with concentrated positions — such as founders holding company stock, employees with equity compensation, or investors subject to lock-up periods — unsystematic risk is very real and very dangerous, even though it’s theoretically diversifiable. Tax implications, liquidity constraints, or legal restrictions can prevent diversification, making unsystematic risk a practical concern even if theory says it “shouldn’t” matter.
4. “The market” is not always well-defined
Systematic risk is measured relative to a market proxy — typically the S&P 500 for U.S. equities. But what is “the market” for a global investor? A U.S. recession might be systematic risk for U.S. stocks but only partially systematic for Japanese or European equities. Currency risk, country-specific regulations, and regional economic cycles create layers of systematic risk at different scales. The CAPM’s “market portfolio” is theoretically the portfolio of all risky assets globally, but in practice we use proxies like the S&P 500, which introduces measurement ambiguity. This is part of Roll’s critique of the CAPM: we can never observe or test the true market portfolio.
Frequently Asked Questions
Disclaimer
This article is for educational and informational purposes only and does not constitute investment advice. The concepts of systematic and unsystematic risk are foundational to portfolio theory, but individual investment decisions should consider your personal financial situation, risk tolerance, and investment objectives. Beta values and risk decompositions cited are illustrative examples and may differ based on the data source, time period, and methodology used. For comprehensive training on portfolio construction and risk management, see our Portfolio Analytics & Risk Management course. Always conduct your own research and consult a qualified financial advisor before making investment decisions.
Keep reading
Next in this series
Part 16 of 20 in Portfolio Analytics
Portfolio Rebalancing: Strategies, Costs, and Best PracticesMore in Portfolio Management
-
Investment Policy Statement & RRTTLLU Framework: Complete Guide
Learn what an investment policy statement (IPS) is, how to write one using the RRTTLLU framework, and why it is the cornerstone of the portfolio management…
-
Annualized Return (CAGR): Formula, Calculation, and Examples
Learn how to calculate annualized returns (CAGR) and understand the critical difference between geometric mean and arithmetic mean for measuring multi-year…
-
Financial Leverage in Investing: How to Amplify Returns (and Losses)
Learn how financial leverage amplifies portfolio returns and losses, how to measure leverage ratio, and the risks of using borrowed capital to invest.


